
By Julia Rivard Dexter, Co-Founder & CEO, Shoelace Learning and Dr. Neesha Desai Ph.D.
Get access to the full white-paper here.
There is a known challenge inside digital learning, and almost no one in the industry seems to want to acknowledge it. But without acknowledgement, we are unable to improve, so here we are.
Most students don’t really use the products schools buy for them. If the school is lucky, the students open the app. If they’re luckier, the students interact with it. But, most of the time, when they interact, they guess removing the opportunity for real learning.
We know this because we measure it, and because the research is unambiguous. A peer-reviewed study published in the 2020 PERC Proceedings found that after the shift to remote learning, the fraction of “rapid guessing” responses on online assessments jumped to over 40% on most modules. This is students submitting answers in under 15 seconds, often without reading the question at all [1]. A 2024 study in IEEE Access on microlearning environments confirmed the same pattern in low-stakes digital learning contexts: rapid guessing distorts the data, hides what students actually know, and quietly erodes the value of every minute they spend on a screen [2].
Utilization is EdTech’s structural failure. And for years, the industry’s answer has been to push the problem downstream, onto teachers, onto parents, and onto dashboards. Just make the kids try harder.
We took a different course at Shoelace. While many EdTech products use gamification to increase student engagement, they generally only use the very easy/basic components like rewarding points and having a shop where students can redeem them. Since the beginning, we’ve known that to make the experience actually sticky and engaging, we needed to have a deeper tie between the student’s interactions with the educational content and the real game mechanics.
This goal has been foundational to how our games are built. Our games have shown that when the educational content and the game mechanics are designed deliberately, embedded seamlessly into games, and tied directly to the things the students already care about, that the games themselves can do the work that just asking for compliance never will.
Over the last few months, we have been testing out our newest feature (and our most direct tie-in between the questions accuracy and game progress). And the results are in, and they are extraordinary.
What We Did
We launched a new feature called the Dream Point Booster (DPB). It was initially beta-tested in our first game Dreamscape in the winter of 2025/26. In late March, we first released it to everyone playing Dreamscape, and then in late April, in our companion game Dreamseeker Drift.
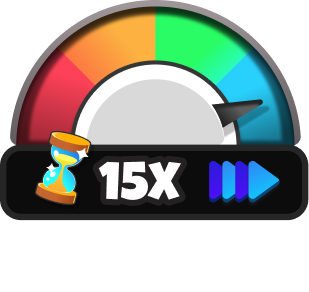
It is, on the surface, a simple thing: a meter on the side of the question window and in the game HUD that climbs when students answer correctly and dips when they don’t. The higher the meter climbs, the bigger the multiplier effect on everything they care about in the game like the “time” for buildings to complete upgrades, the rate that resources accumulate, and the value of power-ups they can win. The DPB takes the abstract idea of try your best and turns it into a visible, in-game incentive that students immediately understand.
Every question students answer feeds a meter. The meter has four zones and each is tied to a multiplier that affects their in-game progression: 1x in red, 5x in orange, 10x in green, 15x in blue. The zones all represent approximate accuracy ranges: < 35% for the red, 36-49% for the orange, 50-60% for the green, and > 60% for the blue. As our internal research has shown that being above 50% accuracy results in real reading growth, having the green zone start at 50% is deliberate [6].
Just as deliberate was our choice to have two zones that represent being in the optimal learning zone (green and blue). The zones need to feel attainable, and many students will be demotivated if they feel they are only successful if they can reach the very top.
When you get questions right, the meter climbs, the multiplier grows and the game accelerates. When you get questions wrong, the meter dips, and progression slows.
We were careful about a few things in the design. It is easier to climb up, the lower on the meter you are, so that getting out of the red or orange zones always feels do-able. On the flip side, we made it harder to stay in the top zones, so that students who reach the top have to keep engaging and maintaining their high accuracy. Finally, we made the whole thing visible everywhere it has a direct impact, so it functions as a real-time, ambient signal of how a student is doing. For the student, for the teacher, and for us.
It was important to us that what the meter did not do was moralize at the students. The DPB never says “stop guessing.” It never lectures. It never penalizes in the punitive sense (game progress is always possible, no matter where you are on the meter). It simply makes the value of trying have a clear impact inside the game to incentivize the right behaviours.
The Data
For our analysis we examined all question attempts that took place during two one-week periods. The first period was November 10-16 2025. This was before any student saw the DPB. The second period was April 26 – May 4 2026 and was after the DPB was released in both games for all users.
From the set of all question attempts, we excluded those that were part of an assignment (assigned by a teacher) or part of the initial placement test. We then divided them out by game source. Table 1 below for exact counts.
Table 1 – Questions
| Before | After | |
| Total Questions Attempts | 713,544 | 568,419 |
| Total Question Attempts excluding Placement Test and Assignments | 676,051 (95% of total) | 525,217 (92% of total) |
| Total Dreamscape Questions | 580,454 | 403,284 |
| Total Dreamseeker Drift Questions | 95,597 | 121,933 |
For each set of data, we also looked at the number of students. And then we narrowed our analysis to students who answered a minimum of 25 questions in the given week. We did this for two reasons. The first reason is that we always recommend that students answer a minimum of 25 questions a week in order to see reading growth. The second reason is that this made sure that our student set focused on students who understand how to play our games and are not in their initial learning phase and/or just hopping in for a very brief period. When we divided students by game, we again required them to have answered a minimum of 25 questions within the specific game. Table 2 below shows the total counts.
Table 2 – Participants
| Before | After | |
| Total Participants | 8,817 | 9,135 |
| Total Participants with 25+ Question Attempts | 4,209 (47.7% of all) | 3,957 (43.3% of all) |
| Total Dreamscape Participants with 25+ Question Attempts | 3,226(76.6% of participants who answered 25+) | 2,657(67.1% of participants who answered 25+) |
| Total Dreamseeker Drift Participants with 25+ Question Attempts | 1,050(24.9% of participants who answered 25+) | 1,394(35.2% of participants who answered 25+) |
All analysis was done on the data sets of students who answered a minimum of 25 questions overall, or within the specific game.
The Results
Once we had our data sets, we examined three different metrics: accuracy, likely guessing, and time taken.
With the Dream Point Booster: Accuracy Went Up.
Table 3 below shows average accuracy for students who answered a minimum of 25 questions either overall, or in Dreamscape or Dreamseeker Drift specifically during our two periods of analysis. In all cases, accuracy increased by a minimum of 5 percentage points.
There was an even larger increase in the number of students who now met our fidelity benchmark of not only answering a minimum of 25 questions during a week, but also keeping their accuracy over 50%. We went from 34.5% of students to just over half at 50.1%, a 15.5 percentage points increase.
Table 3 – Average Student Accuracy
| Before | After | Change | |
|---|---|---|---|
| Overall | 45.6% | 51.1% | +5.5 points |
| Dreamscape | 45.4% | 51.1% | +5.7 points |
| Dreamseeker Drift | 45.2% | 50.3% | +5.1 points |
| Fidelity Play | 34.5% | 50.1% | +15.5 points |
Guessing went down.
When we talk about guessing, we frame it around likely guessing, as we are never 100% sure of a student’s intention. Likely guessing is determined by how quickly a student answers a question. We have two types of questions in the game, independent and passage. For independent questions, we consider answering in ≤2 seconds to be a likely guess. For passage questions, this raises to ≤4 seconds (time determined through a separate data analysis of time to accuracy ratio). As Table 4 shows, we saw a dramatic decrease of about 30% in likely guessing behaviour.
Table 4 – Percentage of Questions Likely Guessed
| Before | After | Change | |
|---|---|---|---|
| Overall | 35.3% | 24.3% | −11.0 points |
| Dreamscape | 38.5% | 27.2% | −11.3 points |
| Dreamseeker Drift | 27.3% | 21.9% | −5.4 points |
Time increased.
Unlike the above two metrics, when it came to time taken, we were hoping to see an increase after the introduction of the DPB, and we did. This was because time taken can be seen as another proxy for intentional answering, or solution behaviour as Skalka and Valko describe it [2]. As shown in Table 5 below, overall students increased the time taken by over 60%.
Table 5 – Average Time Taken Across All Questions
| Before | After | Change | |
|---|---|---|---|
| Overall | 5.7 seconds | 9.2 seconds | +3.5 seconds |
| Dreamscape | 5.1 seconds | 8 seconds | +3.0 seconds |
| Dreamseeker Drift | 8.8 seconds | 12.9 seconds | +4.1 seconds |
Analysis or Why This Matters (even more than it may seem)
Before we introduced the DPB, our accuracy was pretty consistent between games at around 45.5%. This has long been a focus area of ours, because our research, which we’ve written about at length [3], has shown that students using Shoelace start showing real reading-comprehension growth once their accuracy crosses 50%. You may be thinking that the 50% threshold seems quite low. However, our learning engine works to keep students at their Goldilocks threshold, or content that is, in James Clear’s framing, not too hard, not too easy, just right [4]. And because of this, we expect students to be consistently challenged with most of the questions, instead of mainly encountering material they’ve already mastered.
After the introduction of the DPB, as shown in Table 3 above, accuracy rose to closer to 51%, an increase of over 5.5 percentage points. This is extremely important, because it means with the DPB that we’ve moved most of our students up across the threshold to where reading growth accelerates.
In fact, when we look at the change in percent of students who met our fidelity play requirements (a minimum of 25 questions with accuracy >50%), we see just how much of an impact the DPB has had. We went from 34.5% of our students who answered the minimum question goal to 50.1% of these students meeting the fidelity benchmark, an increase of over 15 percentage points!
From our recent Oklahoma tournament, we have seen that students who play with fidelity, can often gain the equivalent of 4 months of reading growth in just 4 weeks of play [5].
What’s most remarkable, is that these changes, the 5.5-point increase in accuracy and the 11-point drop in likely guessing behaviour, all came from a feature students encountered through play. The students chose to let this new feature motivate their behaviour. Even more important, is that this feature was not enabled by, nor influenced by, their teachers, parents, or perceived as a threat. The feature just motivated them to adapt their in-game strategy to optimize their game outcomes. This is the real power of games captured to enhance learning.
This is not a marginal product win. This is a structural shift in how students are spending their time inside our platform.
Two Kinds of Guessing and Why Most Edtech Gets This Wrong
Most digital learning products treat guessing either as a behaviour that needs to be punished (and they lock students out or force them to slow down), or, more commonly, they ignore it entirely.
The research says this is a misunderstanding of what’s actually happening.
In Guthrie, Zhang, and Chen’s analysis of online physics learners, they identified two distinct kinds of fast responses [1]. The first is rapid guessing, where the student isn’t really engaging with the material at all. The second is strategic guessing, where the student has read the question but didn’t fully solve it. These are different behaviours, with different cognitive signatures, and they call for different responses.
Rapid guessing is a disengagement problem. Strategic guessing is a learning-process problem. Punishing both with the same heavy hand misses the point and, often, makes things worse.
The Skalka and Valko study makes this even more concrete: they found that students cluster into distinct groups when you analyze both reading speed accuracy. This means that the same intervention can have wildly different effects across those groups [2]. Often, the students who guess the most are, more often than not, students who haven’t yet been given a reason to slow down.
The Dream Point Booster gives them a reason. And critically, it gives them a reason that is internal to the play experience, not a reason imposed on them from outside it.
What Students and Teachers Told Us
The data is one thing. What people experience is another.
In our beta survey, students were asked whether the meter made them try harder. They answered yes overwhelmingly [6]. They were also asked whether seeing the meter made them anxious, a real concern of ours going in, because we did not want to introduce a feature that turned the joy of play into the dread of a test. The answer was a clear no. Students felt motivated, not stressed.
Teachers reported the same: their students were trying harder, playing differently, and perhaps most importantly, every educator in the beta said the DPB was a good addition to the game.
This matters because the only sustainable way to drive student behaviour at scale is for the student to want to do the right thing. Compliance scales linearly with teacher effort. Motivation scales with design.
The Argument Behind the Argument
We want to step back from the data for a moment and say something that we think matters for the broader edtech conversation.
There is a growing, and largely deserved, backlash against screen time in schools. Districts are rethinking device policies. Parents are skeptical. Teachers are exhausted by tools that promise the world and deliver shelfware. And the loudest voices in the conversation are increasingly arguing that the answer is to pull screens out of classrooms entirely.
I understand the impulse. But it is the wrong conclusion.
The problem is not that students are using screens. The problem is that the industry, for the better part of two decades, has shipped digital products that don’t do the hard work. Products that are boring, or punishing, or pedagogically thin, or that quietly accept guessing as the cost of doing business and call it engagement. When a product is bad, students will guess their way through it, if they ever use it. That is not a screen-time problem. That is a product problem.
Throwing screens out of classrooms because edtech has often been mediocre is throwing the baby out with the bathwater. Done well, and only done well, digital learning can do things that no analogue classroom can scale to: instant adaptive feedback, individualized challenge calibration, and real-time disengagement detection (and response). None of that is possible at thirty-students-per-teacher scale without technology.
But the technology has to actually work. It has to be designed by people who care more about the student’s experience and the learning outcomes than about the demo, the screenshot, or the procurement pitch. It has to be willing to take the harder path: the one where engagement and rigor reinforce each other instead of fighting.
That is the path we have been walking at Shoelace for five years. The Dream Point Booster is the latest step. It will not be the last.
What’s Next
The Dream Point Booster is now live in both Dreamscape and Dreamseeker Drift, and we’re already iterating. We’re studying how the meter behaves across different reader profiles. Fast readers with high accuracy, fast readers with low accuracy, slower readers across the spectrum, because the research is clear that one-size interventions hide the students who need the most calibration [2]. We’re refining how quickly the meter responds, how the zones are tuned, and how we surface the data to teachers so they can spot disengagement earlier.
And we are continuing to ship features under the same operating principle that produced the Dream Point Booster: that engagement, when it’s designed with intention, is not the opposite of rigor. It is the vehicle for rigor.
For too long, our industry has treated those two things as a trade-off. They are not. The students who most need to learn are the students who most need to be engaged, and we owe them products built by people who believe both things at once.
At Shoelace, we do. The data shows why that matters.
References
[1] Guthrie, M. W., Zhang, T., & Chen, Z. (2020). A tale of two guessing strategies: Interpreting the time students spend solving problems through online log data. 2020 PERC Proceedings. https://doi.org/10.1119/perc.2020.pr.Guthrie
[2] Skalka, J., & Valko, M. (2024). Rapid Guessing Behavior Detection in Microlearning: Insights Into Student Performance, Engagement, and Response Accuracy. IEEE Access, 12, 157996–158024. https://doi.org/10.1109/ACCESS.2024.3485505
[3] Desai, N. (2024). 50% Accuracy and the Goldilocks Rule. Shoelace Learning Blog. https://blog.shoelacelearning.com/the-goldilocks-rule/
[4] Clear, J. Atomic Habits, on the Goldilocks Rule. As cited in [3].
[5] Desai, N. (2025). Three Simple Steps to Accelerate Reading. Shoelace Learning Blog. https://blog.shoelacelearning.com/accelerating-reading-outcomes/
[6] Desai, N. (2026). Dream Point Booster Beta Test. Shoelace Learning Blog. https://blog.shoelacelearning.com/dream-point-booster/
[7] Desai, N. (2024). How Shoelace Games Incentivize Accuracy. Shoelace Learning Blog. https://blog.shoelacelearning.com/how-to-use-game-mechanics-to-encourage-accuracy/
What is the Dream Point Booster?
The Dream Point Booster is a meter that is tied to a students (recent) question accuracy. At it’s most basic, the more accurate students are when they answer questions, the higher the arrow will climb and when they get questions wrong, the arrow will dip.
Depending on what zone the arrow is in (indicated by the four colours), each question will have a multiplier attached to it. These range from 1x in the red, to 5x in the orange, 10x in the green and 15x in the blue. The higher your multiplier, the faster buildings and upgrades will complete, reveries will be trained, and new resources can be harvested.
In the classroom, this shows up as more purposeful and intentional practice. Students who keep their average accuracy “high” (over 50%) are rewarded with faster progression. On the other hand, those who begin to guess experience a slow-down in game play that encourages them to slow down and refocus—making the practice time teachers allocate more meaningful.
Now, we took careful steps to make sure that it is possible (and without herculean effort) for students to be able to climb back up, should they fall down to the orange or red. Every zone on the booster represents a range of accuracy and takes multiple correct (or incorrect) questions to move out of it. That said, we also made sure that they need to keep up the effort once they get into the blue and green in order to stay there. That means it’s easier to climb up the farther down you are, and you’ll drop faster the higher you are.
Accuracy and Guessing
Okay, let’s get into some data. First up, the graph below shows the average accuracy of the players in the beta test before and after the Dream Point Booster was turned on.
Let’s start by focusing on the four bars on the left, above the Average DS Accuracy label. For the beta test, the Booster was only enabled in Dreamscape, so for the analysis, I focused on player’s accuracy only on questions they answered while playing Dreamscape.
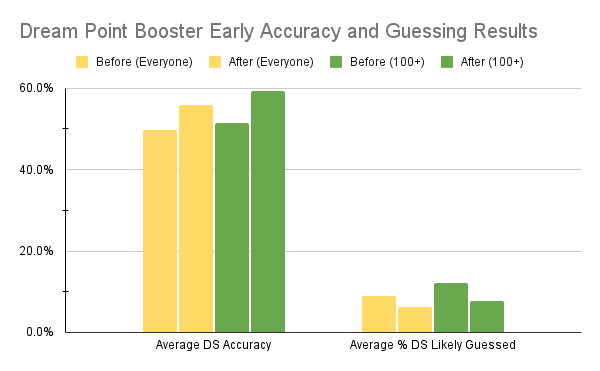
The first two yellow bars represent the overall accuracy of everyone in the beta test before and after, while the two green next to it are just those students who have answered at least 100 questions after the Booster was enabled. As you can see, the overall accuracy increased pretty dramatically for both groups. Overall, it increased by about 6%, and for those with 100+ questions, it increased almost 8%! The 100+ group went from accuracy near 50% (which is the minimum of where we want students) to nearing 60%.
Note: A really cool thing (in my opinion) about the Booster is that it’s a very easy visual check for both you and your students on their accuracy. As stated in our blog post on fidelity, we recommend 25 questions a week and staying above 50% accuracy. 50% accuracy is indicated by the start of the green zone on the Booster. So as long as students are staying in the green or blue, they’re on track.
On the right side of the graph, these four blocks look at the percent of questions that we flag as being likely guessed. Likely guessed questions are questions that are answered extremely fast in comparison to what we normally expect. There are different thresholds for the independent/stand alone questions and the passage questions.
We were really pleased to see a very noticeable drop in the percent of questions that players likely guessed. The overall group had a lower starting average than those with the 100+ questions, but after the Booster was turned on, both groups are now much closer together.
It’s clear from this data, that the Booster is having the effect we wanted on student accuracy and guessing. But how do the educators and students feel about it?
Educator and Student Feedback
We’ve asked all the educators and students who have been participating in the beta for their feedback and have received a lot of it. Let’s see what they think:
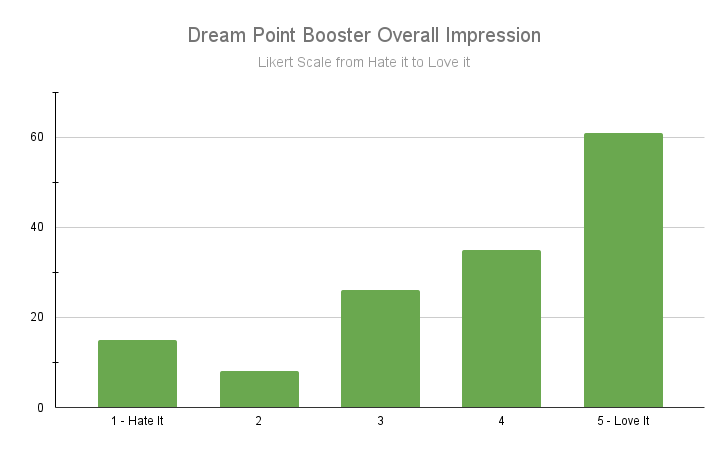
First up: Their overall impression. We asked students to rate us on a scale from Hate it to Love it. And they love it. We also had many comments from them expressing the same.
Next up, we asked students to answer a few true false questions. The first two here are kind of interesting as a pair. First up, students overwhelming answered that the introduction of the Booster made them try harder (which is fantastic). But, they were pretty evenly split on whether it affected how they played the game. This one puzzled me for a bit, and I’m still not entirely sure of the difference. It may be that they separate the questions from the game and considering them two distinct parts.
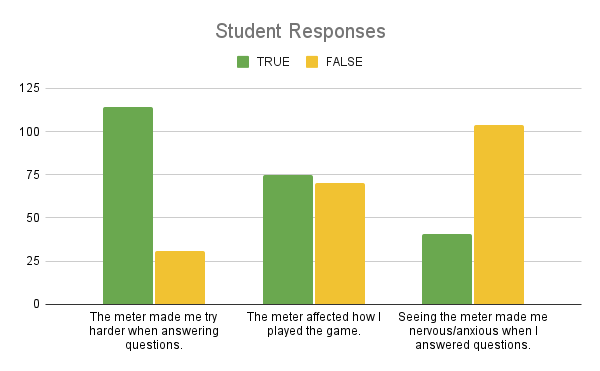
The third set on the graph were focused on a concern we had. We were/are moving cautiously with it’s implementation because we didn’t want the focus on accuracy (even though it doesn’t say that word) to make students worried or anxious when answering. We worried that they may feel afraid to answer if they didn’t know in case the arrow would drop. But, as you can see on the bar, most students didn’t feel this at all. On the flip side, when we asked the educators the same thing, they were very split, as you can see on the second answer on the graph below.
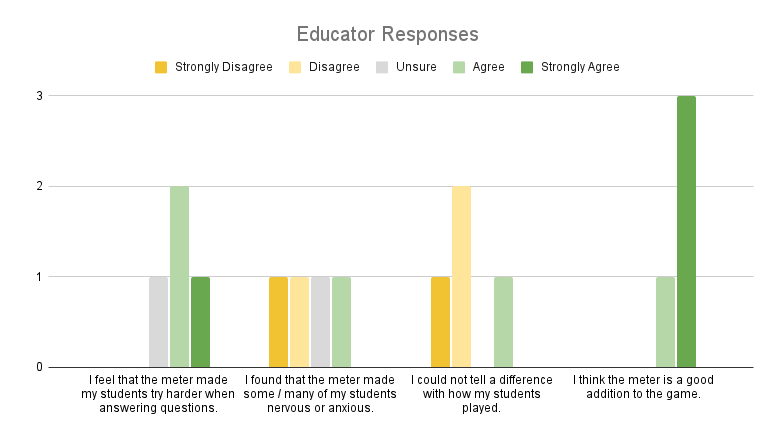
We also asked the educators a few other questions. Like the students, they agreed that the introduction of the Booster seemed to be making their students try harder on the questions. And most of them could tell a difference in how their students played (even if their students couldn’t tell). And, lastly, all of them thought the Booster is a good addition to the game.
What’s next?
We still have a few more tweaks before we’ll be ready to release the Dream Point Booster more widely, but it will be coming to everyone soon. While it’s first iteration is focused on Dreamscape, questions answered over in Drift do affect the position of the arrow. That means it will also be eventually arriving in Drift.